ApchemWiki | RecentChanges | Preferences

Read Section 10.9 Phase Diagram
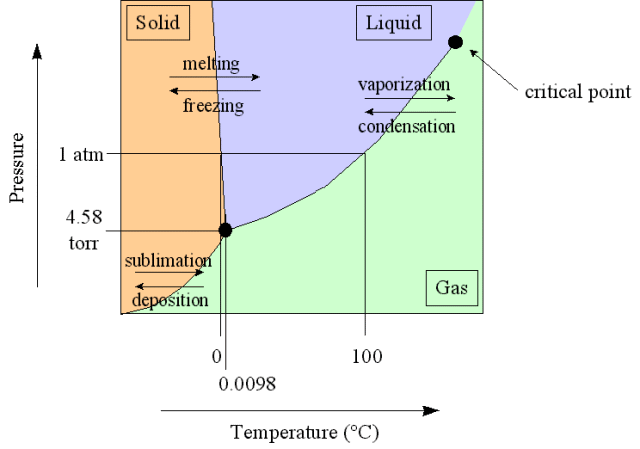
Draw a line showing heating ice to water vapor in a container open to the atmosphere.
What condition exists for each point on every line on the graph (excluded the axises)
What does the line between solid and liquid show? What does it mean that it not perpendicular (in fact sloping backward mean).
Define critical point (i.e. critical temp and critical pressure)
What is the other large dot on this graph symbolize and what does this condition mean (or show).
Read Pg480-483 and answer following questions.
Using Fig 10.43 and Fig 10.46, explain Case 1-3 and define all bolded words on these page.
